Plan your visit · By month
Laguna Beach weather
Laguna Beach is dry and warm from May through October, with nearly all of its rain falling between November and April. This page lists the monthly averages from NOAA.
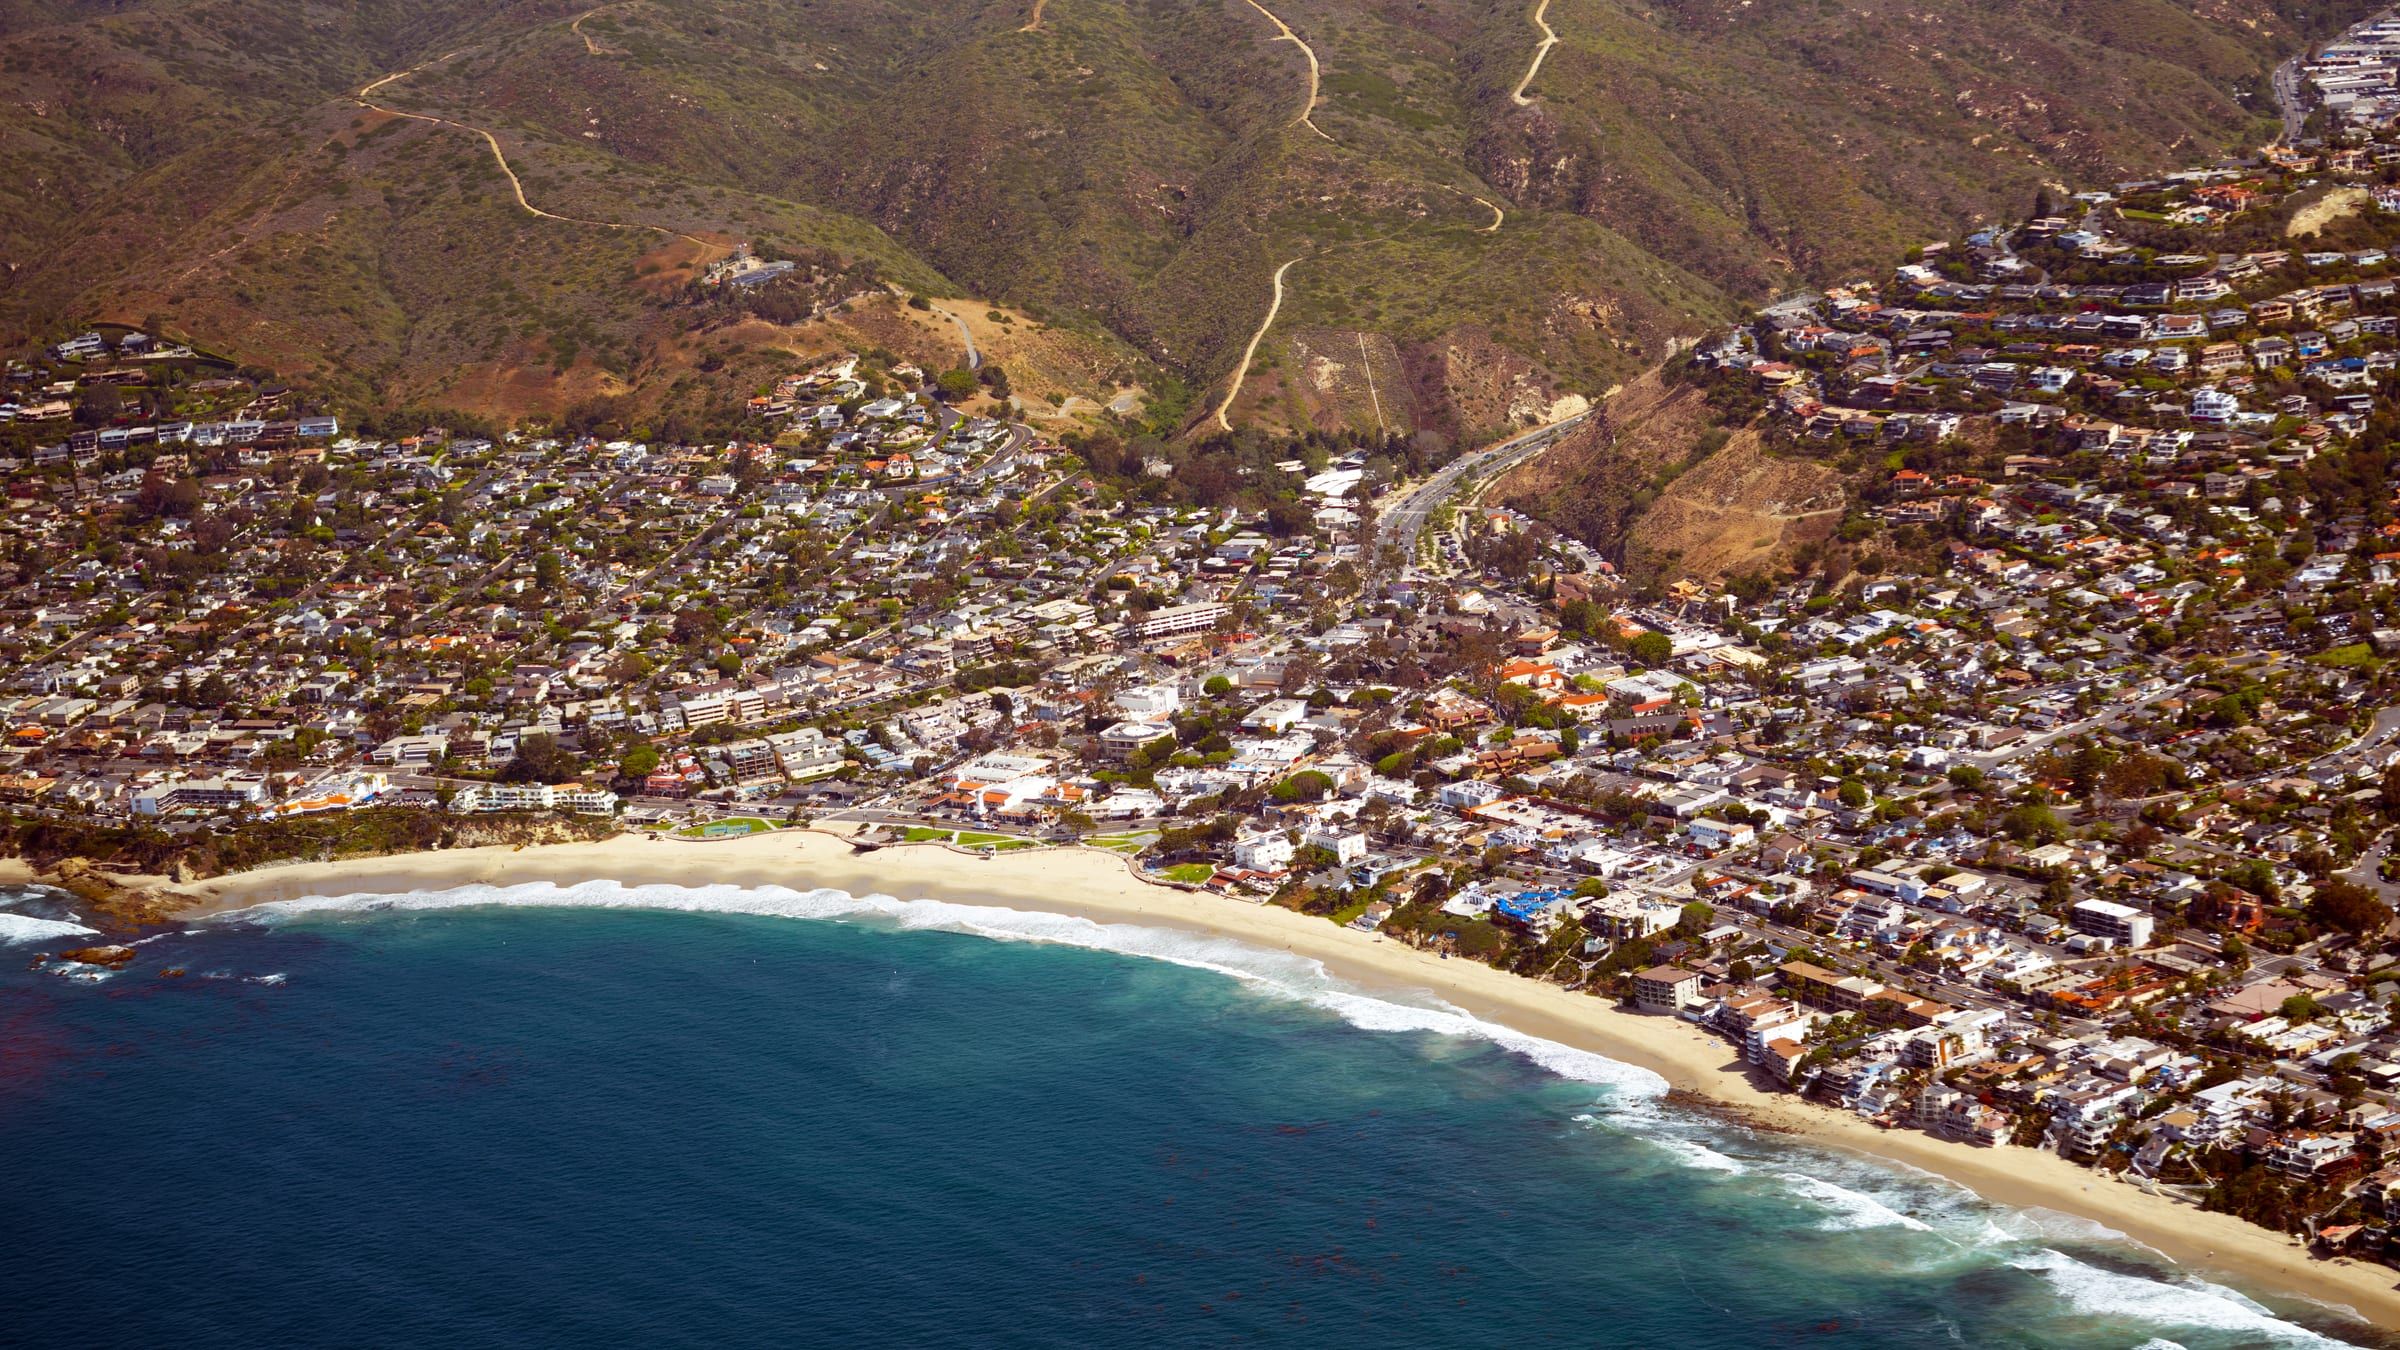
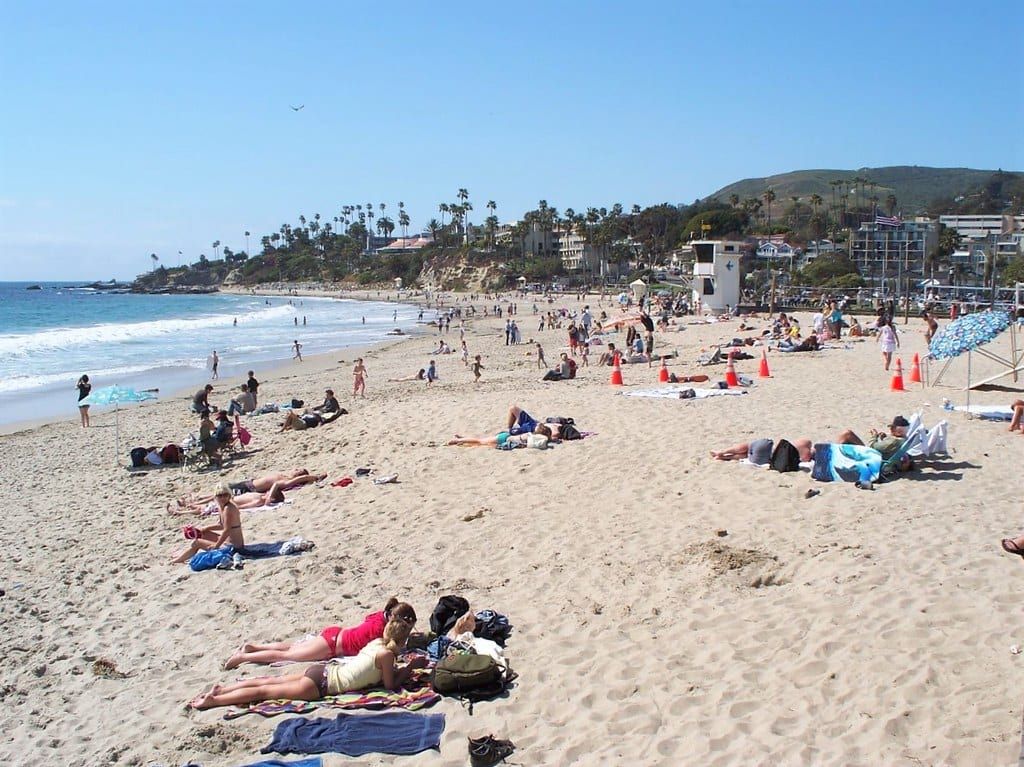
Photo: Don Ramey Logan, CC BY-SA 4.0
- Warmest month
- August, 81°F average high
- Coolest month
- December, 67°F average high
- Wettest month
- February, 3.39 in
- Annual rain
- 12.68 in
- Ocean range
- 59°F to 70°F
Laguna Beach weather by month
These are NOAA’s 1991 to 2020 U.S. Climate Normals for the Laguna Beach station. A normal is a 30-year average, so any single day can run warmer, cooler or wetter. Ocean temperatures come from a buoy whose readings NOAA publishes, covered below the table.
| Month | Avg high | Avg low | Rain | Days with 0.10 in or more | Ocean (typical) |
|---|---|---|---|---|---|
| January | 68°F | 44°F | 2.78 in | 4.9 | 60°F |
| February | 68°F | 45°F | 3.39 in | 5.3 | 59°F |
| March | 69°F | 48°F | 1.62 in | 3.2 | 59°F |
| April | 73°F | 50°F | 0.80 in | 2.0 | 60°F |
| May | 75°F | 55°F | 0.20 in | 0.7 | 62°F |
| June | 76°F | 58°F | 0.11 in | 0.5 | 66°F |
| July | 80°F | 60°F | 0.11 in | 0.1 | 68°F |
| August | 81°F | 61°F | 0.02 in | 0.0 | 70°F |
| September | 81°F | 59°F | 0.16 in | 0.4 | 70°F |
| October | 77°F | 55°F | 0.49 in | 0.9 | 68°F |
| November | 72°F | 49°F | 1.13 in | 1.4 | 64°F |
| December | 67°F | 44°F | 1.87 in | 3.2 | 62°F |
Temperatures are rounded to whole degrees. For the same numbers grouped by season, with festivals, whales and the summer trolley, see the best time to visit.
Warm and dry from May to October
Average highs climb from 75°F in May to 81°F in August and September, and they ease to 77°F in October. Average lows run from 55°F in May to 61°F in August. Rain is rare in these months. No month from May through October averages more than half an inch, and August averages 0.02 inches. The count of days with 0.10 inch or more is under one for each of those six months.
Rain falls from November to April
Of the 12.68 inches the normals add up to in a year, 11.59 inches arrive from November through April. February is the wettest month at 3.39 inches, followed by January at 2.78 inches. Counting days with 0.10 inch or more, February averages 5.3 and January 4.9.
Winter days stay mild by the numbers. Average highs sit between 67°F and 68°F from December through February, and December is the coolest month. Nights run about 23 to 24 degrees cooler than the days in those months: average lows are 44°F in December and January and 45°F in February.
Marine layer, May Gray and June Gloom
NOAA explains that cold ocean water cools the air above it, and that this cooled air, trapped under a temperature inversion, is the marine layer. The layer can cool until clouds or fog form low to the surface, and on the West Coast it can persist for days or weeks, particularly along the coasts of Central and Southern California. Because it persists in early summer, NOAA says, people in Southern California often call it May Gray or June Gloom. Laguna Beach is on that coast, so plan for cloud on some May and June mornings, and check the day’s forecast before you go.
Ocean temperature
The ocean figures come from station 46253, San Pedro South, a Scripps Institution of Oceanography buoy whose readings NOAA’s National Data Buoy Center publishes. It sits about 23 miles west of Laguna Beach. The figures below average its readings from 2015 through 2025 by calendar month.
- Coldest: about 59°F in February and March.
- Warmest: about 70°F in August and September.
- Fall: 68°F in October and 64°F in November.
The buoy sits offshore in 66 meters of water, so use its numbers as a guide to the season, not as a reading at the shoreline. For wind, waves and rip currents on the day you visit, see ocean safety. Whale season and the other seasonal draws are on the whale watching and events pages.

Keep planning
Related pages
-

-
-
-
-
-
-

Questions
What is the warmest month in Laguna Beach?
August, with an average high of 81°F and an average low of 61°F. September has nearly the same average high, 81°F, according to NOAA's 1991 to 2020 normals for the Laguna Beach station.
How much does it rain in Laguna Beach?
The normals add up to 12.68 inches a year. February is the wettest month at 3.39 inches, and August is the driest at 0.02 inches.
What are May Gray and June Gloom?
NOAA says people in Southern California use those names for the marine layer because it persists in early summer. The marine layer is air cooled by cold ocean water, and it can cool enough for clouds or fog to form low to the surface.
How warm is the ocean at Laguna Beach?
At the San Pedro South buoy, NOAA data buoy station 46253, the 2015 to 2025 monthly averages run from about 59°F in February and March to about 70°F in August and September. The buoy is offshore, so it is a guide rather than a reading at the sand.
Thinking of moving here?
Get the printable moving checklist by email: before you move, moving week and your first 30 days.
Last reviewed
Sources (4)
- Monthly average high, average low, precipitation and days with 0.10 inch or more, 1991 to 2020 U.S. Climate Normals, station USC00044647 LAGUNA BEACH, CA US: ncei.noaa.gov, checked 2026-10-27
- NDBC station 46253, San Pedro South, CA: Waverider buoy at 33.576 N 118.182 W in 66 m of water; station information submitted by Scripps Institution of Oceanography; about 23 miles west of Main Beach by great-circle distance from these coordinates: ndbc.noaa.gov, checked 2026-10-27
- NDBC historical standard meteorological files for station 46253, 2015 to 2025, water temperature column, averaged by calendar month: ndbc.noaa.gov, checked 2026-10-27
- Cold ocean water cools the air above it; the air below the resulting temperature inversion is the marine layer, which can cool until clouds or fog form low to the surface; the west coast marine layer can persist for days or weeks, particularly along the coasts of Central and Southern California; because of its persistence in early summer, people in Southern California often call it May Gray or June Gloom (read via Wayback capture 2025-11-26): noaa.gov, checked 2026-10-27